
Presentation system of industrial processes SP3
provides the possibility of continuous recording, processing, archiving and visualization of measurements on the basis of data collected from sensors of measuring systems, with which SP3 has configured connection.
The system is adapted to the requirements of the mine dispatcher service through the implementation of its main functions, namely:
graphical presentation of current and archived measurements on any size scalable boards, diagrams, maps, etc., in a way adapted to the user’s perceptual capabilities taking into account the current technological and ventilation schemes of mine
alarming in critical situations and warning of the occurring dangers
archiving of measurements and alarms data
displaying of archival measurement data in the form of graphs or alphanumerically
creation and printing of reports and generating statistics based on archival measurements
identification of the type, number and source of sensor measuring system
the possibility of multi-monitor work, settings adjustment and save the created configuration for user convenience
determining the extent of individual user accounts
Configuration of Presentation system of industrial processes SP3
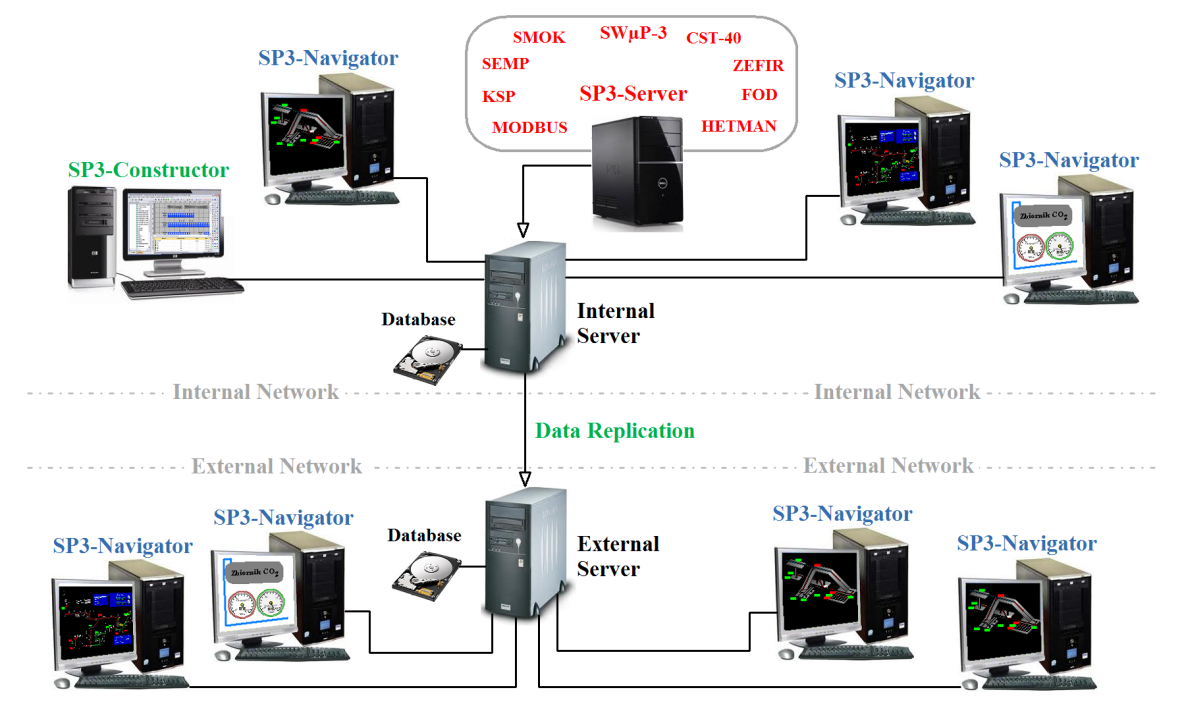
System SP3 is composed of the following, connected to each other with computer network, modules:
SP3-Constructor
SP3-Navigator
SP3-Server
SP3-Constructor
allows the creation of any kind of fully scalable charts, maps, diagrams, on which are placed the objects animating display of user-defined sensors available in the system. The extensive set of graphical tools, like the library of ready components, allows quick creation of advanced and powerful graphical charts and edit those already existing in the system.
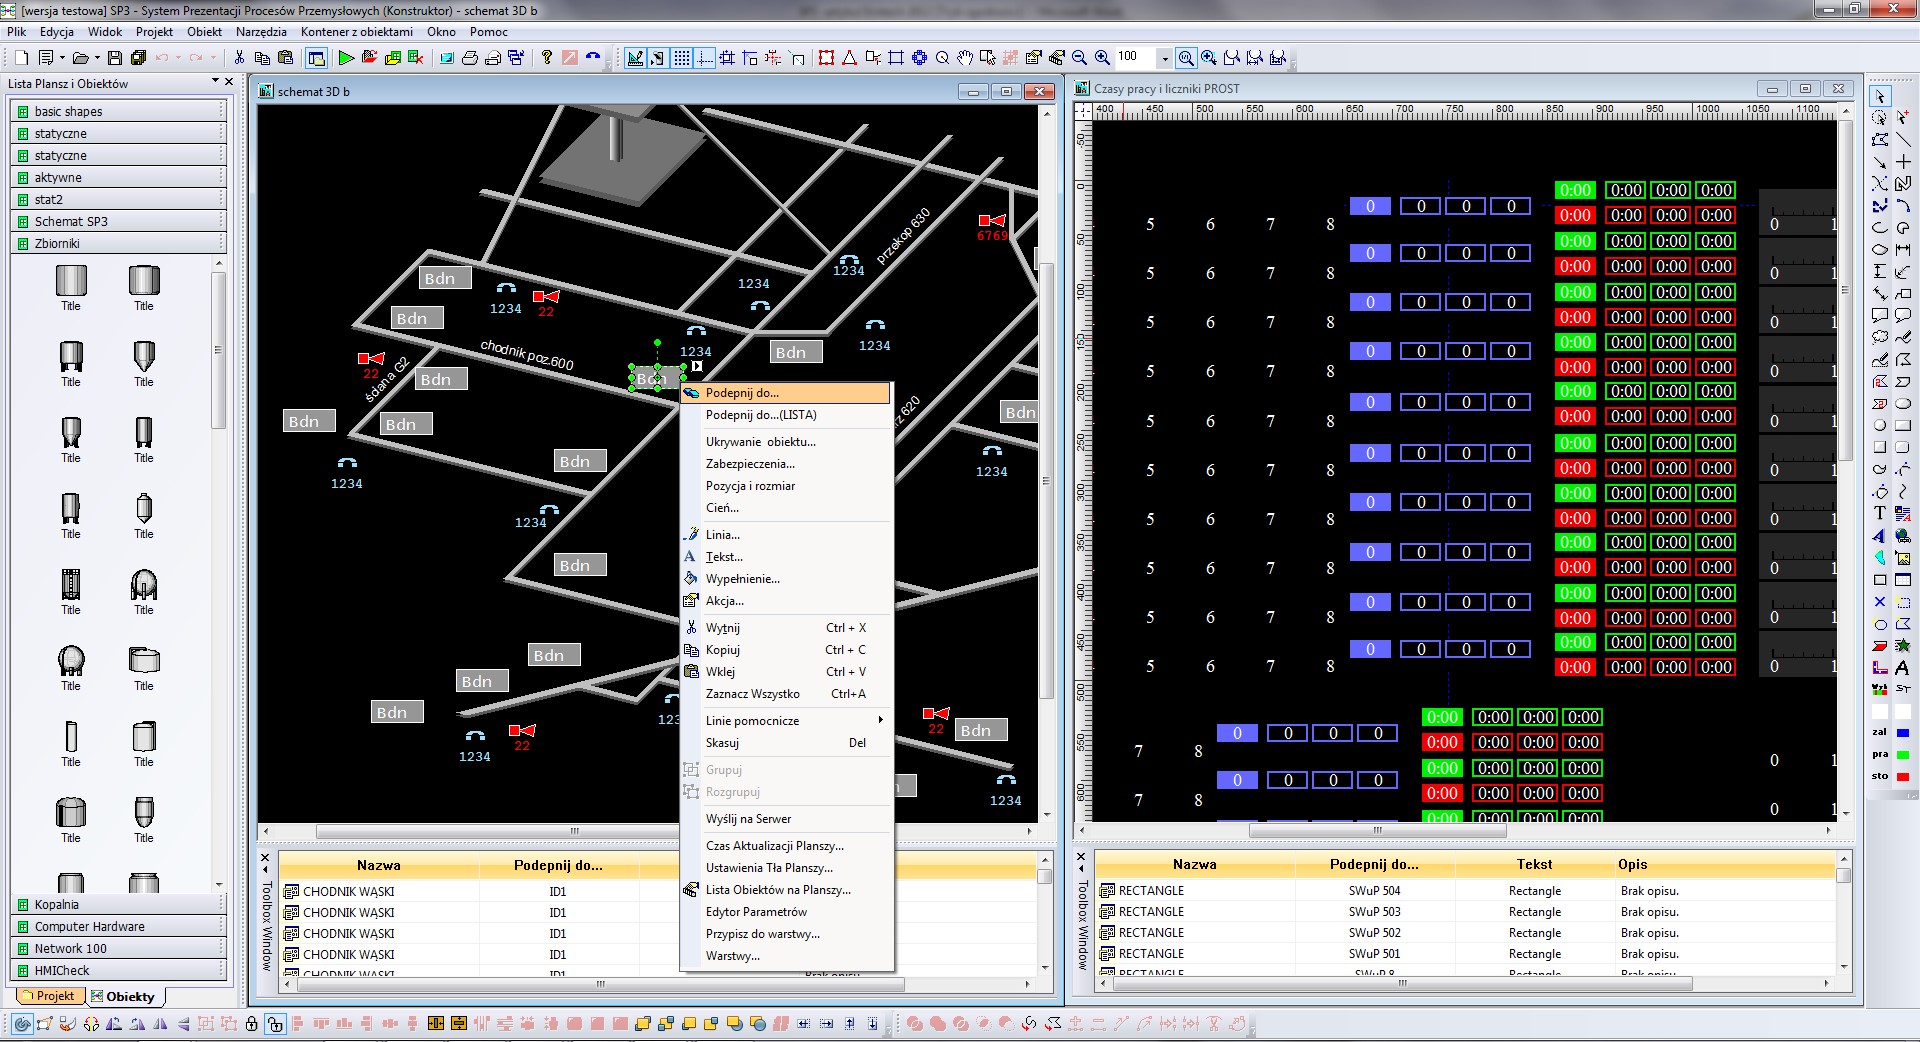
SP-3 Constructor program window
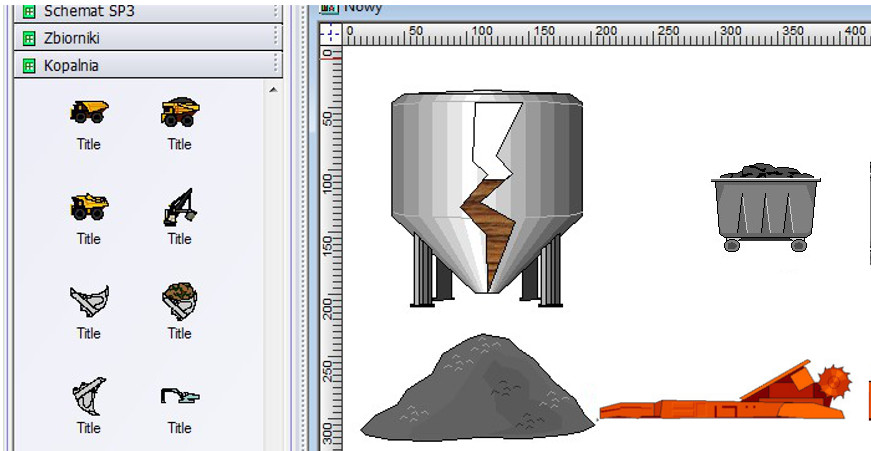
Library of objects ready to be placed on the board.
SP3-Navigator
allows to run previously created charts in separate windows, and provides for continuous monitoring of current measurements (also in the form of graphs). The charts and graphs are displayed in the windows that you can freely distribute on monitors or other display devices.
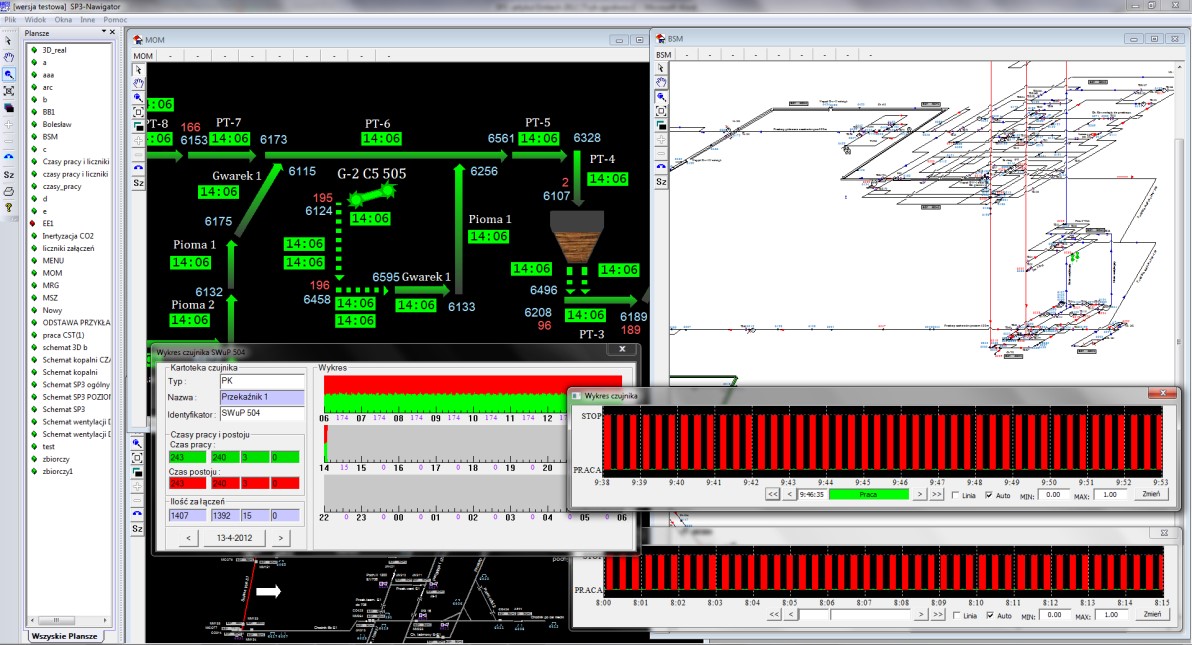
SP3-Navigator program window.
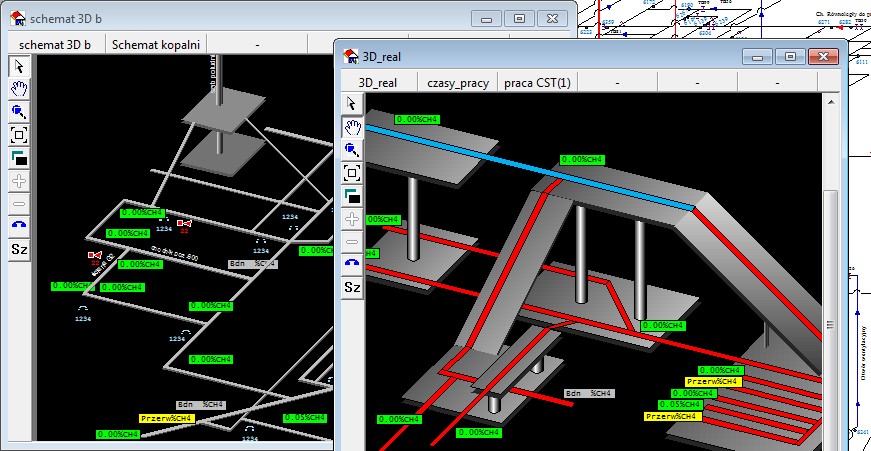
An example of program operation SP3-Navigator.
SP3-Server
is used for the collection, archiving and sharing of data for the entire system.
The main advantages of the system SP3:
The possibility of collection data from various systems (SWuP-3, ZEFIR, SMP, SMOK, FOD, PLC, etc.)
Observation of measurements from various systems in one place
An extensive palette of graphical tools
Simple, intuitive operating